Every data scientist knows that sometimes data is loud, incomplete and unstructured. It is comparable to the mess that a kid leaves after having played with Lego.
Data can have too many dimensions which make it harder to analyse and, subsequently, harder to use.
If a company embarks into an expensive data collection process only to find the data noisy and difficult to analyse, there’s a financial loss there and future R&D efforts are halted.
However, not all is lost. Because where traditional data analysis approaches fail, the topological analysis of the data shines.
Let’s dive in.
In general, topology is basically a mathematical concept that focuses on the characteristics of a geometric object, such as points and angles, that continuously change when they are bent, twisted, stretched without breaking them.
For example, objects with holes, like a doughnut or slice of Swiss cheese, don’t break when deformed.
In simple words, the topology of an object is basically just studying the holes they have and their shape.
Topological data analysis (TDA) refers to the practice of analysing the data using the concept of “topology”. In other words, the topological analysis of the data refers to studying the shape of a dataset.
It is about trying to bend, stretch, twist and reduce the dataset’s dimensions to 3 without breaking it to understand its shape and physical characteristics.
For example, if you have a noisy and incomplete dataset about a train station and your aim is to understand more about its occupancy, i.e. how many people can be in the train station at the same time without it being a safety hazard.
By conducting a topological analysis, you’ll reconstruct the system that generates the dataset to understand it more. Therefore, you’ll learn about holes in the train station, e.g. how many entrances are there in the train station and how many people get through them.
A topological data analysis aims at providing an understanding of what’s not reflected in the data, but is very much present in said data.
Are you asking yourself what sets the topological data analysis apart from other models?
Primarily, its ability to make insights appear from thin air.
Topological data analysis provides advanced data analysis, as it combines concepts of machine learning, statistics and mathematical algorithms. This sounds like a nightmare for a student, but it is actually heaven for a company trying to extract the unseen bits of a dataset.
It divides the data to comprehend the unseen characteristics of segments and sub-segments of a dataset.
Topological data analysis and machine learning are two tools that when combined can really make a difference.
This collaboration has been named “topological machine learning”.
The synergy between the study of the shape of a dataset and machine learning algorithms creates an infrastructure in which a deeper meaning is gathered from the data and allows to gain new perspectives on the dataset.
The topological data analysis and machine learning combo is a match made in heaven. Most models try to understand what the constraints are.
However, TUBR is on a mission to understand the system that provides you with a dataset with the aim of telling you what the physical constraints are and to extract everything from the data.
Nothing beats a blog than a demonstration of what we do here at TUBR. So why don’t you book a call to see how we can get the most out of your data?
Spatial Time Series is an interesting and curious concept. As discussed in our earlier blog all about Spatial Time Series, it’s all about feeding a Machine Learning algorithm with data points collected over a very specific interval of time and defined by their spatial position.
Though there are a lot of applications for this in the business world, the real power of Spatial Time-Series lies in its capabilities of bringing real change in the fight against climate change.
Exploiting the Machine Learning model to understand what changes will take place due to global warming can help policymakers to delineate a set of proactive measures to avoid natural disasters – rather than taking on reactive acts when the earth shakes or the tsunami hits.
According to this research paper, most of the data around biological effects of climate change are collected seasonally which lacks the spatial and the temporal changes that take place in a microenvironment.
Well, Spatial Time-Series is here to provide exactly that.
Spatial Time-Series is becoming increasingly important in understanding global warming, predicting future temperatures and helping with environmental decision making.
A group of researchers from Ghent University and Chinese Academy of Agricultural Sciences have published an interesting article in the Advances in Atmospheric Sciences journal.
Their research focused on implementing a time series modelling to examine one of the most important environmental variables, the monthly records of absolute surface temperature.
This demonstrated that the surface temperature is going to rise and that their model can be used along with other environmental models to implement short-term environmental decision-making.
This model has the capabilities of improving communication between policy makers, environmentalists and researchers to bring active solutions on the table in terms of land utilisation, rising sea levels and natural disasters.
Unfortunately, examples of extreme weather are becoming more and more frequent.
Just three months ago, India and Bangladesh were hit by heavy rains that caused the water levels of rivers to rise and flood all cities. It goes without saying that people were harmed and buildings were damaged.
Another example is brought by the extreme heatwave that Europe has experienced this past summer. This caused wildfires as well as extreme droughts.
In this context, Machine Learning and Spatial Time-Series can be the solution policy makers have been looking for to fight climate change and, most importantly, come up with preventive measures to fight natural disasters.
For example, one of the main benefits of using Spatial Time-Series is its ability to predict future outcomes. By analysing labelled data and identifying patterns, the most at-risk areas of future natural disasters will be predicted and policy makers will be able to implement proactive strategies to minimise the effects.
The goal of many companies is to reach “Net Zero” which means that they are trying to reduce the carbon emission that is generated by their operations.
According to the EPA, the total emissions of CO2 were around 5,981 Million Metric Tons of CO2 equivalent just in the USA. In this figure, the transportation industry contributed by 27% and is the largest source of greenhouse emissions.
The greenhouse gas in the transportation industry comes from the use of fossil fuels to operate vehicles.
Spatial Time-Series is a powerful tool to use to reduce the carbon emissions caused by transport and traffic. For example, if councils performed an analysis of the hourly or daily traffic volume data, they could understand the number of cars going from A to B and implement innovative strategies to reduce the traffic with effective urban planning that incentives the use of alternative means of travel.
According to the IPCC, creating new buildings and maintaining them accounts for one fifth of the world’s emissions.
Not a great figure that puts managing infrastructure and offsetting carbon emissions at the top of the areas to tackle in the fight against climate change.
Spatial Time Series can help in managing and reducing the environmental impact of buildings, especially in cities.
For example, councils could use Spatial Time Series to understand which areas in the city are the most carbon intensive because of the heating and ventilation of their buildings. This could help policy makers to promote alternative energy to heat or to use electricity.
To wrap up, climate change is a phenomenon that we are all dealing with. It is still not a reality that we have to accept and there are steps that can be taken to reduce or to mitigate its effect. The solution lies in new technologies and the power of using untapped data.
Spatial Time Series is a powerful tool which has the ability of helping save cities and people by predicting and helping decision makers in their jobs.
To outsource or not to outsource, that is the question.
Well, according to 70% of B2B decision-makers, delegating certain tasks and operations to an external company is the most effective way to ensure time-saving and cost-saving.
There are numerous challenges that businesses are facing everyday. These challenges are not only caused by big historical events such as Covid-19, but are also caused by shifts on a smaller scale, like higher fuel prices or national strikes.
There’s only so much a company can do. You can be a great logistics provider and you want to optimise your performances, but do you really think that creating an in-house machine learning algorithm is the best way to approach this or would you rather put the experts in charge?
Just some food for thought!
Adding machine learning solutions to your operations needs the expertise of highly trained technical staff. This is a rule set in stone. No amount of Coursera courses or self-teaching on YouTube will give you what you are looking for.
You could hire data scientists and build an in-house model, but have you conducted a research on Glassdoor to see how much is the average salary of a data scientist or machine learning developer?
In this case it is not about soft skills, it is all about technical hard skills that are developed through years of studying and training. The issue that you might be facing might be too complex for your staff to deal with.
This is why working with a predictive analytics platform that turns small data into actionable insights is the best decision for you. We have a great team of machine learning developers who are eager to get their hands on your data to help you meet your targets from the get go, without any training required, only your spreadsheets.
Big data has been a buzzword for quite some time now. The new buzzword is small data.
It means that the enormous amount of data that is around us is not of concern, your business data is. Outsourcing to TUBR means that you can execute highly targeted projects without impacting your core business.
Do you want to improve your customer service experience without consistent data, but it is peak season for Christmas deliveries and you do not know where to start?
TUBR is what you’ve been looking for. We have adopted a physics approach to understand how data is connected, validating gaps and recreate a system into a model in which external factors support the prediction.
This means that we find relationships between the data and actively fill the gap to provide you with predictions that are reflected in the external environment.
Multitasking is only enjoyable when your tasks are simultaneously eating and watching Netflix, not when improving your customer service experience while delivering Christmas presents.
By outsourcing your machine learning processes, costs will be reduced, profits will increase and your accountant will be happy.
Why?
Well…
These are just two prime examples of how much you will save by outsourcing to a company who is going to provide you with all the predictions you need, without going bankrupt.
There’s nothing more unifying all businesses than the fear of not complying to GDPR regulations.
A skilled and highly trained machine learning workforce understands the need of handling, storing and systematically managing small data on various platforms.
Outsourcing to a predictive analytics platform such as TUBR reassures you that the company’s sensitive information is kept secure and far from malicious eyes.
Ultimately, there’s many more reasons that go above and beyond the basics we’ve outlined here. TUBR is the company you want to work with if you want to reduce waste and optimise your assets efficiently and without breaking the bank.
Why don’t you give us a call?
Everyone is aware of the role data has, in providing uncountable benefits to society, businesses and individuals.
When we think of data, we think of health data collected by our smart watches or entertainment data collected by our likes and dislikes on social media. This high amount of data is known as Big data.
In recent years, it is not enough to talk about Big data anymore and other types of data have become increasingly important, such as small data and sparse data.
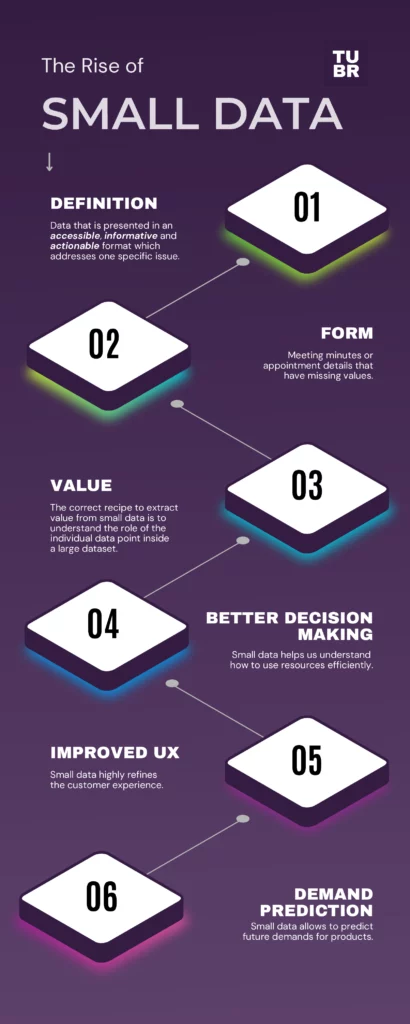
Small data is the opposite of Big data. In simple words, we refer to small data when we deal with data that is presented in an accessible, informative and actionable format which addresses one specific issue.
On the other hand, sparse data refers to the instance in which a variable has a high number of cells that do not contain actual data. For example, an example of variable without data can be excel or Google sheets rows with a few cells empty or N/A. Even though these cells are empty, they still occupy storage space in the file.
For example, if you’re trying to make predictions to understand the number of people at a specific station then the data collected would not make enough data to use machine learning. Therefore, additional data points could mean that the view of that specific station is skewed so you want to make the data you do have available valuable.
This is a simple but effective way of showing the differences.
Smaller data inputs could also mean the dataset is incomplete, such as missing values that create gaps in the dataset making it hard work with.
Nevertheless, there is value in sparse data, even for machine learning. For every data set that includes what we consider “big data”, there’s a huge amount of small data that goes to waste.
For example, let’s say that a meteorologist is tracking snowfalls throughout the year. They want to study three specific variables:
To better track their data, they create a spreadsheet in which they place the three variables as columns and the months as rows. As it happens, there will be months in which it does not snow and no data will be stored for said months. On the other hand, data will be recorded for the months in which it snowed. The result is a sparse dataset as there are useful data points as well as useless data points.
Research has shown that if small data is analysed through human factors, numerous insights can be gathered. These insights are notoriously more accurate, transparent and valuable.
The correct recipe to extract value from small data is to understand the role of the individual data point inside a large dataset.
For example, if you’re trying to understand how to efficiently manage your assets, small data is what you need. A retail company might want to meet the needs of customers by estimating how much staff to have in the store depending on the time of day. Usually, mornings are busier as everyone is buying their meals for the office so more staff is needed than in the afternoon.
This is how small data works inside a big dataset.
Small data can be powerful when its value has been correctly extracted. One of the ways of doing so is by using time-based prediction.
Time-based prediction is the process of analysing time-dependent data which means that a specific time period is examined with the aim of predicting data that belongs to a different period, e.g. the future.
For example, a retail shop might want to predict when parking spaces are more likely to be available so they can attract disability customers when parking it more likely to be easier
Normally, machine learning models require thousands and thousands of data points. Big data can be complex and hard to manage. Data collection creates issues of speed, can create gaps and often inconsistencies in how it is collected can silo the data into smaller data values as part of the bigger whole
On the other hand, small data can provide decision-makers with important insights when they are conducting time-based predictions. Startups and SMEs can understand future business challenges by using the limited data that they store without engaging in an expensive data collection process.
Small data plays a big role in business, pun intended.
According to the World Economic Forum, small data presents numerous benefits to companies:
Small data, big dreams. Even though massive improvements have been made, there are a lot of data challenges. Whether you want to optimise your assets, reduce waste or improve the customer experience, it does not matter if you don’t have thousands and thousands of spreadsheets.
TUBR can help so send us an email at seethefuture@gettubr.com.